
History Graphs for ,
High Temperature
Low Temperature
102.8°F
71.2°F


High Humidity
Low Humidity
95%
42 %
High Dewpoint
Low Dewpoint
83.0°F
68.0°F
High Wind Speed
28.0 mph
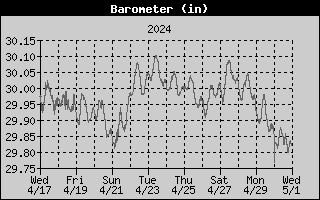
High Barometer
Low Barometer
30.067 in
29.609 in
Rain Total
4.14 in
High Rain Rate
72.00 in/hr
Low Wind Chill
71.0°F
High Heat Index
131.0°F
High UV
13.3 index
High Solar Radiation
1281 W/m˛
High Temperature
Low Temperature
102.8°F
21.0°F
High Humidity
Low Humidity
98%
20%
High Dewpoint
Low Dewpoint
83.0°F
7.0°F
High Wind Speed
29.0 mph
High Barometer
Low Barometer
30.491 in
29.569 in
Rain Total
13.67 in
High Rain Rate
72.00 in/hr
Low Wind Chill
14.0°F
High Heat Index
131.0°F
High UV
13.3 index
High Solar Radiation
1287 W/m˛