Lightning / 2000 Map
LIVE WEATHER UPDATES
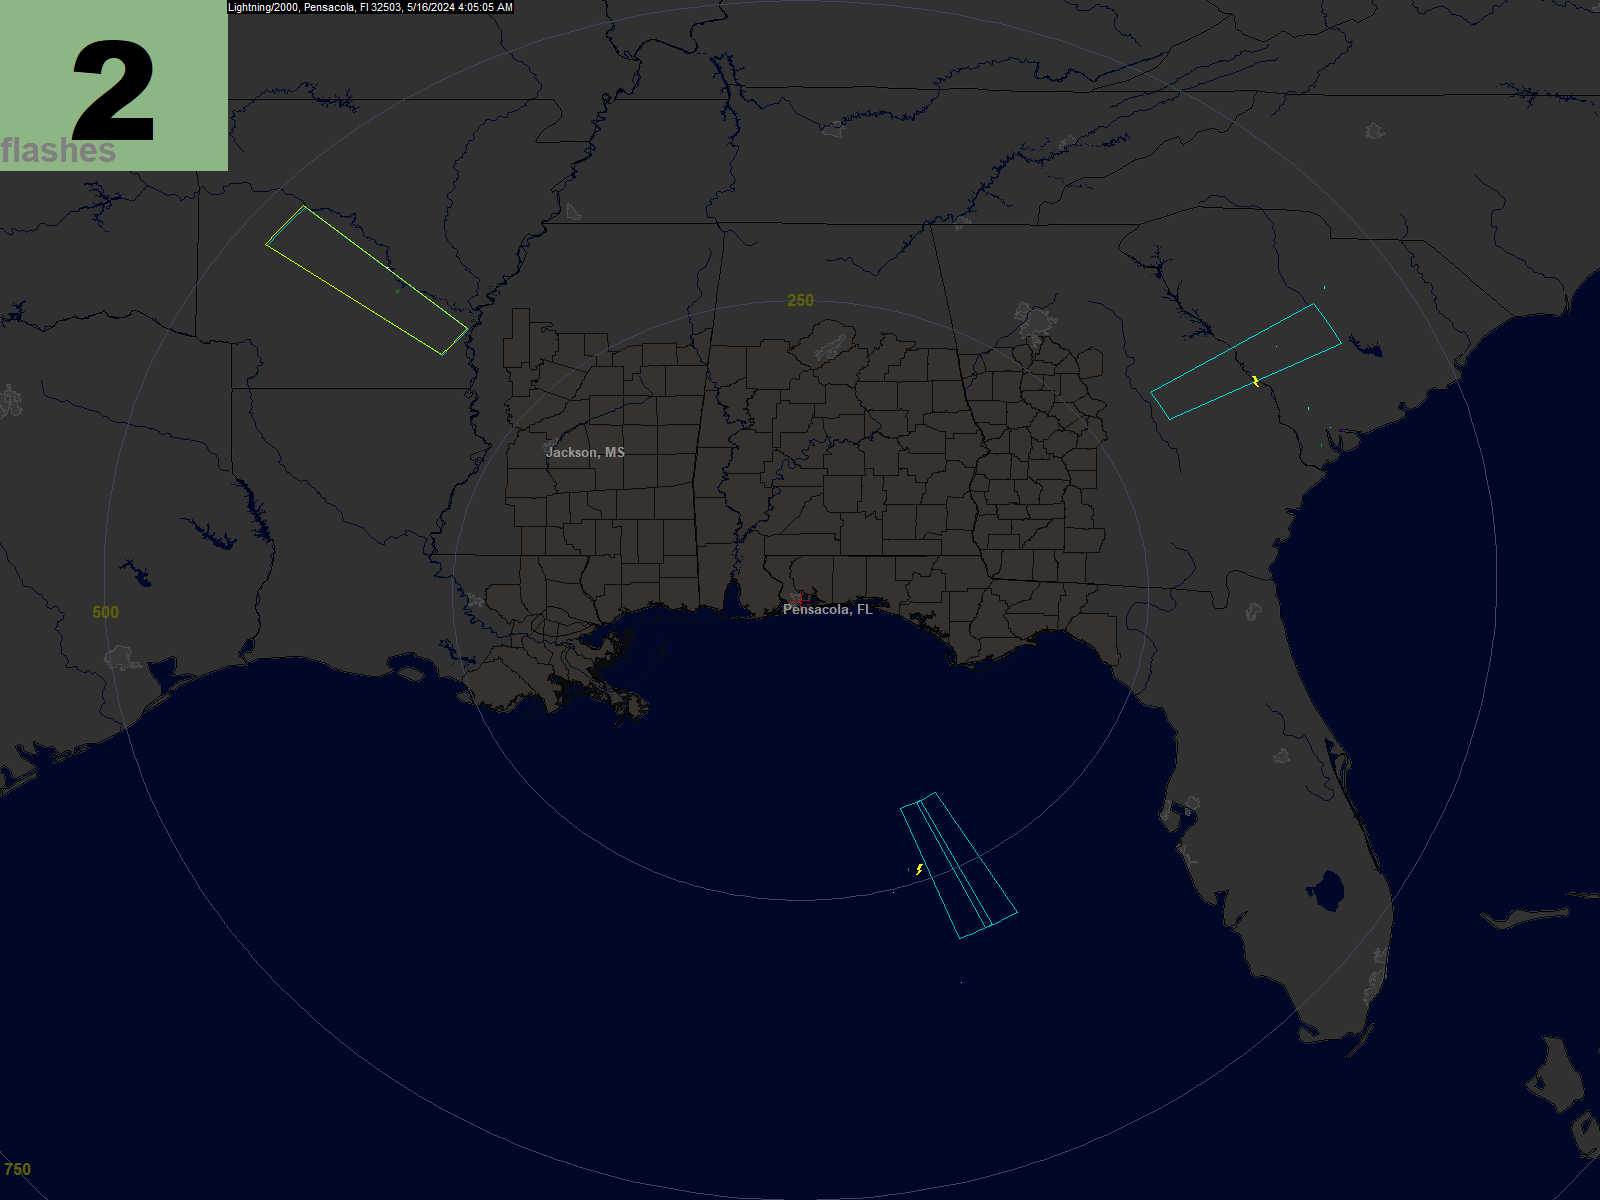
Lightning / 2000 Map
For the newest strokes, cloud-to-ground is shown as a small yellow lightning bolt, and intercloud/intracloud is shown as red triangles.
For older strokes, green and cyan denote cloud-to-ground discharges, and blue and pink denote intercloud/intracloud discharges.
Occasionally, we will switch briefly to a display that shows only CG or IC strokes. If the screen capture occurs during one of those times, you will see that reflected in the display.


This is a graph of the lightning activity over the last hour.
When showing lightning flashes (the normal mode), the blue-green represents -CG flashes, while the light green represents +CG flashes. The brighter magenta is -IC and the darker magenta represents +IC flashes. The flash counts will always be lower (sometimes much lower) than the stroke counts.
When showing strokes, the darker green area represents -CG strokes, while the cyan represents +CG strokes. Blue is +IC and pink is -IC.
The yellow numbers are the peak flash count and the time it occurred.
For the newest strokes, cloud-to-ground is shown as a small yellow lightning bolt, and intercloud/intracloud is shown as red triangles.
For older strokes, green and cyan denote cloud-to-ground discharges, and blue and pink denote intercloud/intracloud discharges.
Occasionally, we will switch briefly to a display that shows only CG or IC strokes. If the screen capture occurs during one of those times, you will see that reflected in the display.